Section: Costs & Savings
How Much Do Solar Panels Cost in 2026? Full Price Breakdown by System Size
By ClearWatt Editorial Team · Published July 22, 2026 · Last updated August 9, 2026
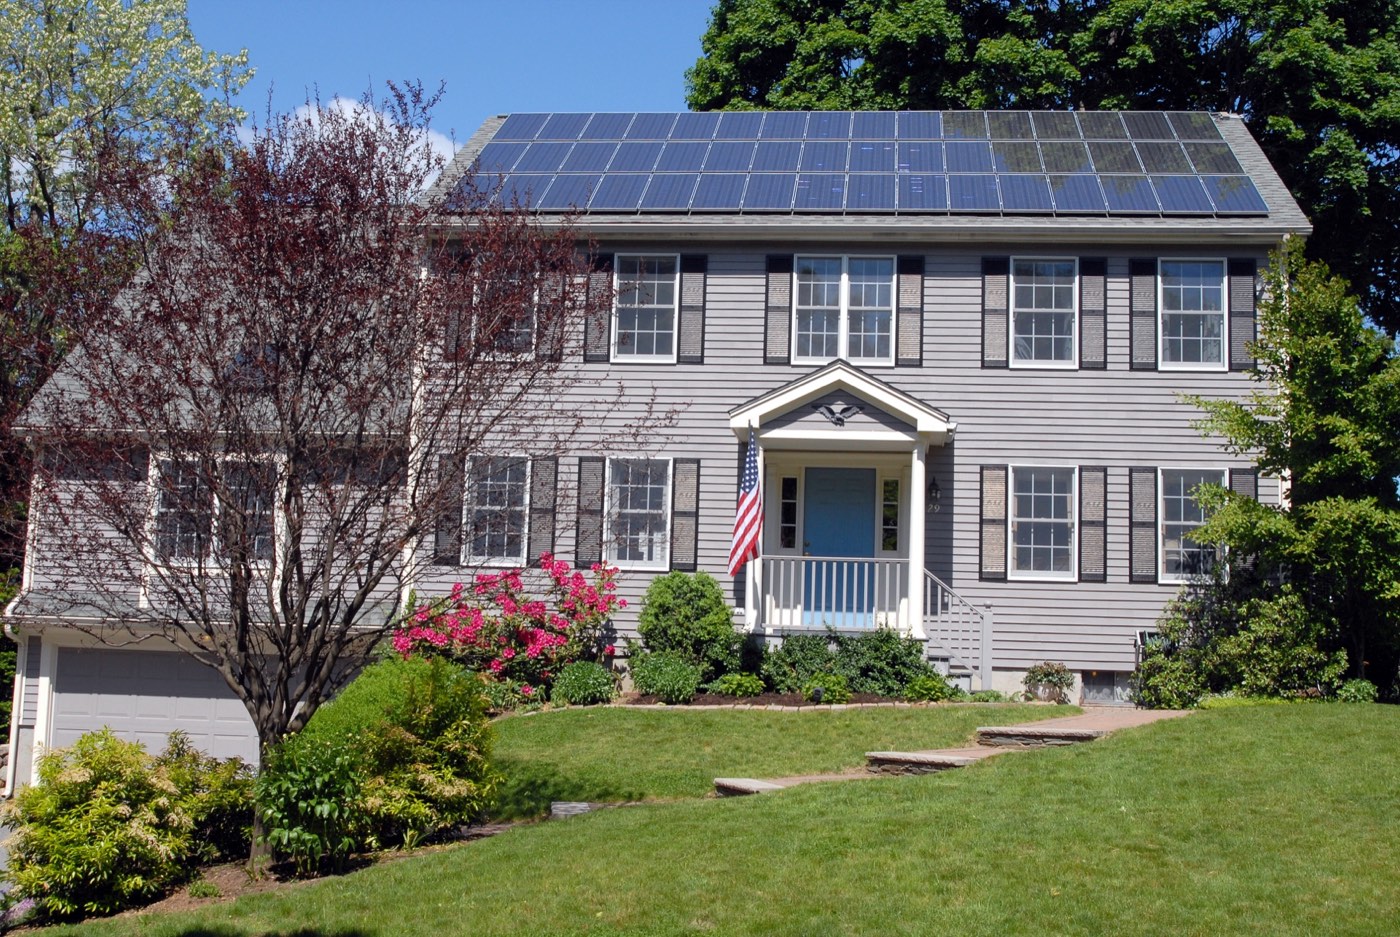
Solar panels typically cost between $15,000 and $36,000 before incentives in 2026, depending on system size, with most homes needing a 6kW to 8kW system priced around $18,000 to $28,000. EnergySage’s marketplace data (updated July 31, 2026) puts the national average at $2.60 per watt before incentives; broader market pricing outside their marketplace commonly runs $2.50 to $3.50 per watt. Because the federal tax credit ended January 1, 2026, these figures are now close to what most homeowners will actually pay — there’s no 30% reduction to subtract for a purchased system.
What determines the price you’re quoted
Solar pricing is not standardized. Two homes with identical roofs in the same city can get quotes that differ by thousands of dollars, driven by:
- System size (kW) — the biggest single factor, since cost scales roughly with the number of panels and the inverter capacity needed to handle them.
- Panel and inverter brand — premium panels (higher efficiency, longer warranties) and microinverters or power optimizers cost more than standard panels with a single string inverter.
- Roof complexity — steep pitches, multiple roof faces, shading obstacles, or an older roof that needs reinforcement all add labor and material cost.
- Local labor and permitting costs — installer labor rates, local permit fees, and inspection requirements vary significantly by city and utility territory.
- Installer overhead and margin — national installers and small local crews price differently; a bigger sales and marketing budget often shows up in the quote.
- Added equipment — battery storage, panel-level monitoring, or a roof replacement bundled into the project can meaningfully raise the total.
Because of this, any number in this article is a planning range, not a quote. Use it to sanity-check bids you receive, not to predict your exact invoice.
Average cost by system size
EnergySage’s marketplace data (updated July 31, 2026) breaks out average pricing by system size:
| System Size | EnergySage Average Cost | Cost per Watt |
|---|---|---|
| 5 kW | ~$13,900 | ~$2.78 |
| 6 kW | ~$16,080 | ~$2.68 |
| 8 kW | ~$20,960 | ~$2.62 |
| 10 kW | ~$25,800 | ~$2.58 |
| 12 kW | ~$31,135 | ~$2.56 |
These marketplace figures tend to run toward the lower end of the market, since EnergySage quotes come from installers competing for the platform’s leads. If your own quote lands closer to $3.00-$3.50 per watt, that’s still within the broader range installers report outside any single marketplace — it doesn’t necessarily mean you’re being overcharged. Either way, these are gross figures before any state or utility incentives are applied, and there is no federal credit to subtract from them for a purchased system in 2026 (more on that below).
Run the numbers for your own home
Table averages are a starting point, not your actual math — your real payback depends on your own system cost, your electricity rate, and your local sun hours. Enter your own numbers below (it defaults to the current U.S. average residential rate from the EIA):
Your estimate
- Estimated annual production
- —
- Estimated annual savings
- —
- Net cost after incentive
- —
- Simple payback period
- —
- Estimated 20-year net savings
- —
Assumes a system derate factor of 0.8 (typical real-world losses from inverter efficiency, temperature, soiling, and wiring) and that your utility credits exported solar at close to your full retail rate. It does not account for future electricity rate changes, panel output degradation, or financing costs — treat this as a starting point, not a quote.
How much solar do a 2,000 sq ft house typically needs
Sizing depends far more on electricity usage than square footage, but as a rough guide, a 2,000 sq ft home with typical usage and moderate sun exposure often needs a system in the 6kW to 8kW range. Homes with electric heating, a pool, or an EV charger commonly need 8kW to 10kW or more. Your installer should size your system from your actual utility bills (ideally 12 months of usage), not from square footage alone — ask for that calculation explicitly if a quote doesn’t show it.
Why the federal tax credit no longer lowers your net cost
Through 2025, most homeowners could subtract 30% of total system cost from their federal tax bill under Section 25D of the tax code. That credit ended for systems placed in service on or after January 1, 2026, under the One Big Beautiful Bill Act (H.R. 1), signed July 4, 2025 — with no phase-down or transition period.
Practically, this means:
- 2025 purchase, placed in service by Dec 31, 2025: Eligible for the 30% credit. A $21,000 system effectively cost about $14,700 after the credit.
- 2026 purchase (cash or loan): No federal credit. That same $21,000 system costs $21,000, full stop, for the homeowner.
- Solar lease or PPA, any year: The homeowner never claimed Section 25D directly in this structure, since the leasing company owns the equipment. That company may still access a separate commercial credit (Section 48E) on its own schedule, and some providers factor an expected credit into the monthly rate they quote — but this is not guaranteed and is not the same as a credit on your own tax return.
This is the single biggest change to the solar cost equation in 2026: the same system that cost roughly 30% less net-of-incentives in 2025 now costs its full sticker price if purchased outright. For the full breakdown of what changed and who is and isn’t affected, see Federal Solar Tax Credit 2026: What Changed and What You Can Still Claim.
Does going solar still make financial sense without the credit?
Cost is only half the equation — the other half is what you save on electricity over time, which depends on your local utility rates, your state’s net metering rules, and any remaining state or local incentives (some of which are unaffected by the federal repeal — check DSIRE for your state). Whether the math works for your specific home depends on your rate, your usage, and your system cost — see Is Solar Still Worth It in 2026? for a full framework, and use our solar savings calculator, which pulls its default electricity rate from live EIA data, to run the numbers for your own address and utility rate.
Average cost of solar panels by state
State-level averages vary widely and shift often, driven by differences in labor cost, permitting complexity, local competition among installers, and remaining state incentives. As a general pattern, states with more mature solar markets and streamlined permitting tend to see somewhat lower installed cost per watt due to installer competition and standardized processes, while states with newer or smaller solar markets can see higher per-watt costs. We don’t publish a specific state-by-state cost ranking here because the figures we could source varied enough between providers to be unreliable — check EnergySage’s local pricing data for your specific state, and treat it as one data point among the multiple local quotes you should collect either way.
Cash, loan, or lease: how financing changes your real cost
The gross cost figures above assume a cash or loan purchase, where you own the system outright. A solar lease or power purchase agreement (PPA) works differently: instead of paying for the hardware, you pay a fixed monthly fee or a per-kWh rate for the electricity the system produces, often with $0 down.
- Cash purchase has the lowest total lifetime cost, since there’s no interest or lease markup, but requires the full amount upfront.
- Solar loan spreads the same gross cost over time with interest, raising the total paid but avoiding a large upfront outlay while still giving you ownership (and eligibility for any remaining non-federal incentives).
- Lease or PPA usually requires little or no money down and shifts ownership (and maintenance responsibility) to the provider, but typically costs more over the system’s lifetime than a cash purchase, and the homeowner does not own the equipment or claim any tax credit directly.
Because the federal credit no longer applies to owned systems, the cost gap between buying and leasing has narrowed somewhat compared to 2025 — but leases and PPAs still typically cost more over 15-25 years than a cash or loan purchase, since you’re paying for financing and provider margin throughout the contract. See Solar Loan vs. Lease vs. PPA for a detailed side-by-side comparison of total cost under each option.
Ways to reduce your solar cost in 2026
With the federal credit gone, homeowners looking to lower their net cost have fewer options than in prior years, but a few levers remain:
- Get at least three quotes. Installer pricing for comparable equipment can vary by thousands of dollars for the same job.
- Check state and utility incentives. These are separate from federal tax law and some regions still offer rebates, performance payments, or property tax exemptions for solar.
- Right-size the system. An oversized system costs more without proportionally more savings if you’re not using or exporting the extra power efficiently under your utility’s net metering rules.
- Consider mid-tier equipment. Premium panels and battery add-ons raise cost significantly; a standard panel package is often sufficient for typical homes.
- Ask about cash discounts. Some installers offer a lower price for cash payment versus financed purchases, since financing carries origination fees passed through to you.
Bottom line
Expect to pay roughly $2.50 to $3.50 per watt before incentives in 2026 (EnergySage’s marketplace average is $2.60), which puts a typical 6kW to 8kW home system at roughly $18,000 to $28,000 gross — and, for a purchased system, that gross figure is now close to your actual net cost, since the 30% federal credit no longer applies. Before signing anything, get multiple written quotes sized to your actual usage, confirm what state or utility incentives (if any) still apply in your area, and run your specific numbers through a savings calculator rather than relying on national averages. If a quote comes in well outside the ranges above, ask the installer to explain why — it may be justified by your roof or equipment choice, or it may simply be priced high, and knowing the difference is easier once you’ve compared it against at least two other quotes side by side.
Sources
- EnergySage, “How Much Do Solar Panels Cost?” (marketplace data, updated July 31, 2026) — energysage.com (consulted August 9, 2026)
- U.S. Energy Information Administration, retail electricity price data — eia.gov (consulted August 9, 2026)
- IRS, “Residential Clean Energy Credit” (Section 25D) — irs.gov (consulted August 9, 2026)
- H.R. 1, One Big Beautiful Bill Act, 119th Congress — congress.gov (consulted August 9, 2026)
- DSIRE (Database of State Incentives for Renewables & Efficiency) — dsireusa.org (consulted August 9, 2026)
Frequently asked questions
How much do solar panels cost for an average house in 2026?
A typical home needs a 6kW to 8kW system, which runs roughly $18,000 to $28,000 before any incentives, or about $2.50 to $3.50 per watt. Actual cost depends on your roof, local labor rates, equipment choice, and installer, so treat this as a planning range rather than a quote.
Is there still a tax credit to lower the cost of solar panels in 2026?
No federal tax credit is available to homeowners who buy a system outright or with a loan in 2026 — the 30% Section 25D credit ended January 1, 2026. Some state and utility incentives may still apply, and solar leases or PPAs work differently because the leasing company, not the homeowner, may access a separate commercial credit.
What is a normal cost per watt for solar panels in 2026?
Most residential solar quotes in 2026 fall between $2.50 and $3.50 per watt before any incentives, with premium equipment or complex roofs pushing toward the higher end and simple installs with standard panels landing lower. This figure already reflects the removed federal credit, since there is no longer a 30% reduction to apply on top of it.
What's the cheapest way to go solar in 2026?
Cash purchase has the lowest total cost over the system's life since it avoids loan interest and lease markups, but it requires the most money upfront. Getting at least three quotes, choosing a mid-tier equipment package instead of premium panels, and checking for any remaining state or utility rebates are the most reliable ways to reduce the price without changing how you pay.
Written by
ClearWatt Editorial TeamThe ClearWatt Editorial Team researches and writes every guide on this site. We work from primary sources — federal and state agencies (EIA, NREL, DSIRE, IRS), legislative text, utility rate schedules, and manufacturer documentation — rather than summarizing other websites' coverage of the same topic. We are not licensed solar installers, financial advisors, or tax preparers, and nothing published here is a substitute for advice from one. When a figure can't be traced to a specific, current source, we say so and give a range instead of a false-precision number. Articles are dated, and we correct confirmed errors promptly. See our Editorial Policy for the full standard every guide is held to, and About & Methodology for the sources we draw from.